 by Ashka Naik, Director of ACUPCC Initiatives, Second Nature
As of September 2013, the ACUPCC reporting system has 1990 Greenhouse Gas Reports, 521 Climate Action Plans and 328 progress reports. As we look deeper into these publicly shared data—submitted by more than 670 institutions over the course of 5.5 years of the initiative—what we see is an intricate picture that is telling of the overall progress made by the US higher education sector in its pursuit to create a sustainable and thriving society. These outcomes can also educate us about the challenges and opportunities confronting our institutions.
In this blog series, we will highlight trends and patterns that emerge from these publicly submitted reports. Our goal in sharing these chronicles is twofold. It is to share the network’s impact by leveraging the power of data. But more importantly, it is to underscore how a committed community of “doers” at higher education institutions has brought this extraordinary higher education sustainability movement to life.
Analyzing submitted reports by Carnegie Classification reveals how different types of institutions are advancing in their Commitments to climate neutrality.
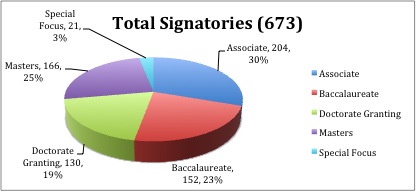
Figure 1: The above chart highlights how different Carnegie Classifications are represented within the ACUPCC.
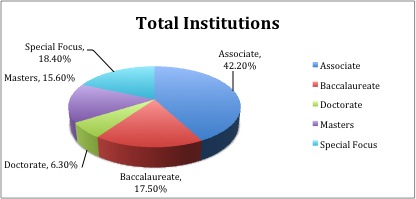
Figure 2: The above chart highlights how different Carnegie Classifications are represented within the entire US higher education sector.
[Source: http://classifications.carnegiefoundation.org/summary/basic.php,
Accessed September 23, 2013].
The largest class within the 673 signatory institutions, 30% (204 institutions) of the network, is comprised of Associate Colleges. The Masters Granting institutions are 25% (166) of the network. Subsequently, the Baccalaureate institutions are 23%, Doctorate Granting institutions are 19%, and Special Focus institutions comprise 3% of the ACUPCC network. (Please see Figure 1.)
Associate Colleges is the only classification that has a lower representation in the ACUPCC than in the overall US higher education sector. They represent 30% of ACUPCC institutions while making up 42.2% of the entire US higher education landscape. (Please note that the 42.2% includes for-profit Associate Colleges as well.)
GHG Reports
Doctorate Granting institutions have shared the most Greenhouse Gas (GHG) reports (515 reports) in the network. And, in spite of being the largest class, Associate Colleges have submitted fewer (480 GHG reports). Additionally, out of all classes, Doctorate Granting institutions have submitted the highest number of GHG reports (4 reports) per institution and Associate Colleges have submitted the least number of GHG reports (2.4 reports) per institution.
One possible explanation for this trend could be that many signatory Associate Colleges have not reached the third year in their reporting cycle. Another assumption could be made that community colleges are challenged with accurately tracking Scope 3 emissions (commuting), and that developing reliable systems for capturing these data could be a daunting challenge. These speculations need further analysis of the data submitted by this class of institutions.
Additionally, Special Focus institutions is the smallest class (3%) within the ACUPCC, even though it is the second largest class (18.4%) within the US higher education sector. This can mean that fewer Special Focus institutions are committing to the ACUPCC, but the following analysis will underscore how the committed Special Focus institutions have overall higher rates of reporting.
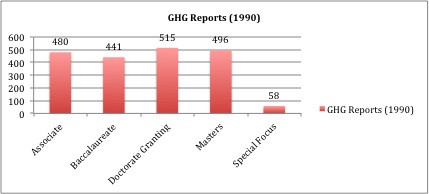
Figure 3: The above chart highlights the number of GHG reports submitted by different Carnegie Classifications.
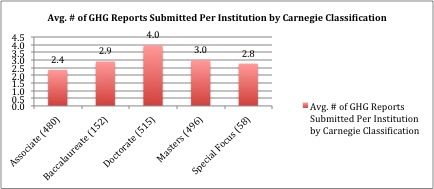
Figure 4: The above chart highlights the number of GHG reports submitted per institution by different Carnegie Classifications.
CAP Reports
Out of all classes, the Baccalaureate institutions, the third largest class within the ACUPCC, have submitted the highest number of Climate Action Plans. However, Special Focus institutions have the highest CAP submission rate (of 86%).
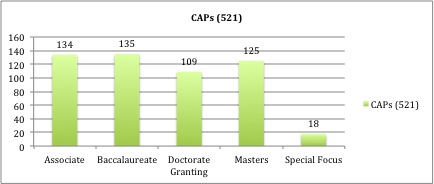
Figure 5: The above chart highlights the number of CAPs submitted by different Carnegie Classifications.
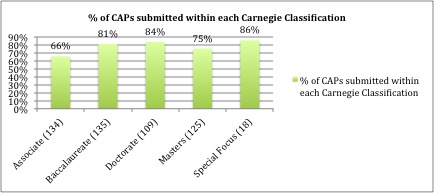
Figure 6: The above chart highlights the % of CAPs submitted by different Carnegie Classifications.
Progress Reports
Out of all classes, the Baccalaureate institutions have submitted the highest number of Progress Reports (88 reports). However, Doctorate Granting institutions have the highest Progress Report submission rate of 67%.
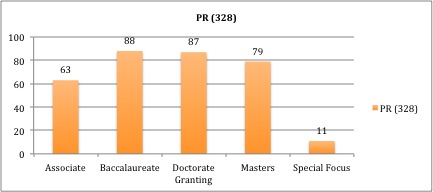
Figure 7: The above chart highlights the number of Progress Reports submitted by different Carnegie Classifications.
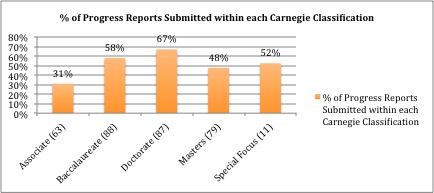
Figure 8: The above chart highlights the % of Progress Reports within each Carnegie Classification.
All in all, these charts demonstrate that each Carnegie Classification is excelling in the overall reporting requirements of the ACUPCC. However, each class has a uniqueness that can be addressed in more strategic way for developing knowledge transfer and synergies within the network.
[NOTE: The ACUPCC is not responsible for the accuracy or validity of the data submitted by signatory institutions. The ACUPCC does not require institutions to verify GHG emissions or any other information submitted in their reports. However, it does encourage and trust institutions to submit the most accurate data available and to be transparent about their data collection processes.]
Add new comment