Data Chronicles

Data Chronicles: Lowest emissions per Fulltime Equivalent and by Square Footage

February 10, 2015

by Amanda Carpenter, Program Associate, Second Nature

Within the American College & University Presidents’ Climate Commitment network, we like to highlight institutions that are making outstanding progress towards their carbon neutrality goals. Two of the metrics that we use to normalize the data are emissions per Full Time Equivalent, and emissions per 1000 square feet. These data points are taken from the self-reported values in the Greenhouse Gas and Progress Reports that are submitted by signatory institutions.

Emissions per Full Time Equivalent

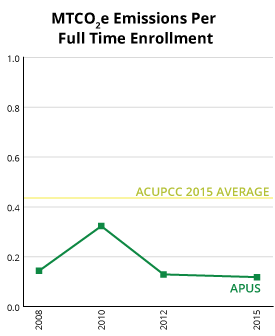
The school that had the lowest gross emissions per Full Time Equivalent was the American Public University System at about 0.1 metric tons of CO2e, rounded up in our system to the nearest tenth. For their 2015 Greenhouse Gas Inventory, the American Public University System reported a Full Time Equivalent of 42136.0 students.

In the narrative section of the 2014 Progress Report, the American Public University System points to its high density and online learning 

programs as being a contributor for their success. 

ACUPCC Progress from Greenhouse Gas Reporting Trends

November 6, 2013


by Ashka Naik, Director of ACUPCC Initiatives, Second Nature


As of November 2013, 616 signatory institutions have submitted 1998 GHG Inventories in total.

616 institutions have submitted at least one GHG report.  492 institutions have submitted at least two GHG reports, with which we have datasets to analyze trends of emission within the ACUPCC network.

Figure 1: The following figure highlights the breakdown of how many GHG reports have been submitted by signatory institutions.

The 492 institutions that have submitted at least two GHG reports present the following trends on their GHG emissions.

  • 286 (58%) of the 492 signatory institutions show a reduction totaling 2,898,816 metric tons of CO2e. 
  • 198 (40%) of the 492 signatory institutions show an increase of 1,196,815 metric tons of CO2e. 
  • 8 of the 492 signatory institutions show no change in their emissions.
  • The cumulative emissions reduction from these 492 signatory institutions is 1,702,001 metric tons of CO2e.

Data Chronicles of October: ACUPCC Reporting by Carnegie Classification

October 1, 2013

by Ashka Naik, Director of ACUPCC Initiatives, Second Nature

As of September 2013, the ACUPCC reporting system has 1990 Greenhouse Gas Reports, 521 Climate Action Plans and 328 progress reports. As we look deeper into these publicly shared data—submitted by more than 670 institutions over the course of 5.5 years of the initiative—what we see is an intricate picture that is telling of the overall progress made by the US higher education sector in its pursuit to create a sustainable and thriving society. These outcomes can also educate us about the challenges and opportunities confronting our institutions.

In this blog series, we will highlight trends and patterns that emerge from these publicly submitted reports. Our goal in sharing these chronicles is twofold. It is to share the network’s impact by leveraging the power of data. But more importantly, it is to underscore how a committed community of “doers” at higher education institutions has brought this extraordinary higher education sustainability movement to life.

Analyzing submitted reports by Carnegie Classification reveals how different types of institutions are advancing in their Commitments to climate neutrality.


Figure 1: The above chart highlights how different Carnegie Classifications are represented within the ACUPCC.


Figure 2: The above chart highlights how different Carnegie Classifications are represented within the entire US higher education sector.
[Source: http://classifications.carnegiefoundation.org/summary/basic.php,
Accessed September 23, 2013].

Subscribe to Data Chronicles